🔍 Step-by-Step Guide to Designing an A/B Test
- Dr Dilek Celik
- Jun 13, 2025
- 2 min read
Updated: Jul 9, 2025

Step 1: Understand the Problem Statement in A/B Test
Business context: Online clothing store (Fashion Web Store) wants to test a new ranking algorithm to improve product relevance and sales.
User funnel:
User visits the website
User searches for an item
User browses results
User clicks on a product
User completes a purchase

Step 2: Define the Success Metric
To choose an appropriate success metric, it must be:
Measurable: Can you reliably collect data on it?
Attributable: Is the change in the metric caused by the treatment?
Sensitive: Can it detect small but important changes (low variability)?
Timely: Can you observe changes quickly (avoid long delays)?
✅ Chosen Metric: Revenue per user per day — a good proxy for long-term sales impact that’s also timely and attributable.

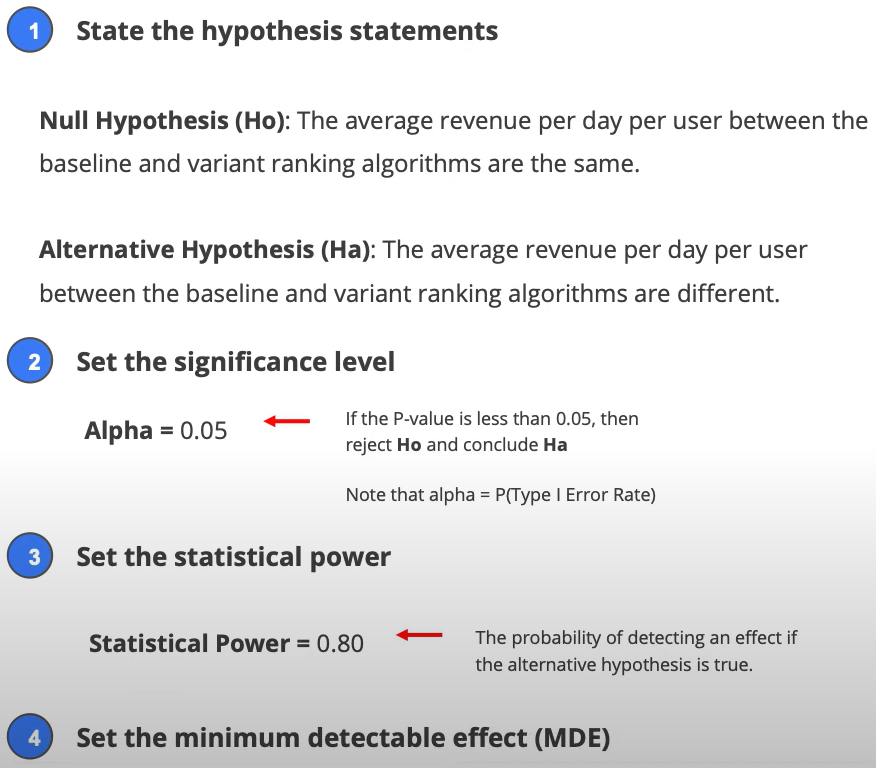
🧪 Step 3: Hypothesis Testing Framework in A/B Test
Null Hypothesis (H₀): There is no difference in average revenue per user per day between the new and old ranking algorithm.
Alternative Hypothesis (H₁): There is a difference between the two.
Set statistical parameters:
Significance Level (α): 0.05
Statistical Power (1 - β): 0.80
Minimum Detectable Effect (MDE): ~1% (common for large-scale tests)
🛠️ Step 4: Design the Experiment in A/B Testing
Randomization Unit: Individual users (not sessions or page views).
Target Population: Users who start searching (as this is where the ranking algorithm applies).
Sample Size:
Formula: n ≈ 16 × (σ² / Δ²)
Where:
σ² = variance of the metric (e.g., revenue per user)
Δ = minimum detectable difference
Experiment Duration: Typically 1–2 weeks (avoid running for <1 week to capture weekday/weekend patterns).

Design the Experiment
✅ Step 5: Run the Experiment in A/B Testing
Use appropriate instrumentation and tracking to collect metrics like search behavior, clicks, revenue, etc.
Ensure correct assignment logic and data logging.

Run the Experiment
⚠️ Step 6: Sanity Checks Before Analysis
Validate:
Proper randomization
Balance of user characteristics across groups
No major data quality or logging issues
This helps ensure any observed difference is due to the treatment — not confounding or bias.

📊 Step 7: Analyze and Interpret Results
Check:
Lift (relative increase)
P-value
Confidence intervals
Also consider:
Practical vs. statistical significance
Impact on secondary metrics (e.g., bounce rate, conversion rate)

🚀 Step 8: Launch Decision
Combine statistical results with business goals to decide:
Launch the new algorithm?
Iterate?
Rollback?

Launch Decisions
🔁 Pro Tip for Interviews:
Always start with business context and user journey before jumping into stats/design.
For company-specific roles (e.g., Meta, Google), analyze their core product’s user funnel in advance so you can adapt this framework confidently during interview A/B test questions.


Comments